Comparing Algorithms
How do you compare two algorithms for solving some problem in terms of efficiency? We could implement both algorithms as computer programs and then run them on a suitable range of inputs, measuring how much of the resources in question each program uses. This approach is often unsatisfactory for four reasons. First, there is the effort involved in programming and testing two algorithms when at best you want to keep only one. Second, when empirically comparing two algorithms there is always the chance that one of the programs was "better written" than the other, and therefore the relative qualities of the underlying algorithms are not truly represented by their implementations. This can easily occur when the programmer has a bias regarding the algorithms. Third, the choice of empirical test cases might unfairly favor one algorithm. Fourth, you could find that even the better of the two algorithms does not fall within your resource budget. In that case you must begin the entire process again with yet another program implementing a new algorithm. But, how would you know if any algorithm can meet the resource budget? Perhaps the problem is simply too difficult for any implementation to be within budget.
These problems can often be avoided by using asymptotic analysis. Asymptotic analysis measures the efficiency of an algorithm, or its implementation as a program, as the input size becomes large. It is actually an estimating technique and does not tell us anything about the relative merits of two programs where one is always "slightly faster" than the other. However, asymptotic analysis has proved useful to computer scientists who must determine if a particular algorithm is worth considering for implementation.
The critical resource for a program is most often its running time. However, you cannot pay attention to running time alone. You must also be concerned with other factors such as the space required to run the program (both main memory and disk space). Typically you will analyze the time required for an algorithm (or the instantiation of an algorithm in the form of a program), and the space required for a data structure.
Many factors affect the running time of a program. Some relate to the environment in which the program is compiled and run. Such factors include the speed of the computer's CPU, bus, and peripheral hardware. Competition with other users for the computer's (or the network's) resources can make a program slow to a crawl. The programming language and the quality of code generated by a particular compiler can have a significant effect. The "coding efficiency" of the programmer who converts the algorithm to a program can have a tremendous impact as well.
If you need to get a program working within time and space constraints on a particular computer, all of these factors can be relevant. Yet, none of these factors address the differences between two algorithms or data structures. To be fair, if you want to compare two programs derived from two algorithms for solving the same problem, they should both be compiled with the same compiler and run on the same computer under the same conditions. As much as possible, the same amount of care should be taken in the programming effort devoted to each program to make the implementations "equally efficient". In this sense, all of the factors mentioned above should cancel out of the comparison because they apply to both algorithms equally.
If you truly wish to understand the running time of an algorithm, there are other factors that are more appropriate to consider than machine speed, programming language, compiler, and so forth. Ideally we would measure the running time of the algorithm under standard benchmark conditions. However, we have no way to calculate the running time reliably other than to run an implementation of the algorithm on some computer. The only alternative is to use some other measure as a surrogate for running time.
Basic operations and input size
Of primary consideration when estimating an algorithm's performance is the number of basic operations required by the algorithm to process an input of a certain size. The terms "basic operations" and "size" are both rather vague and depend on the algorithm being analyzed. Size is often the number of inputs processed. For example, when comparing sorting algorithms the size of the problem is typically measured by the number of records to be sorted. A basic operation must have the property that its time to complete does not depend on the particular values of its operands. Adding or comparing two integer variables are examples of basic operations in most programming languages. Summing the contents of an array containing \(n\) integers is not, because the cost depends on the value of \(n\) (i.e., the size of the input).
Growth Rates
The growth rate for an algorithm is the rate at which the cost of the algorithm grows as the size of its input grows. The following figure shows a graph for six equations, each meant to describe the running time for a particular program or algorithm. A variety of growth rates that are representative of typical algorithms are shown.
Growth rates
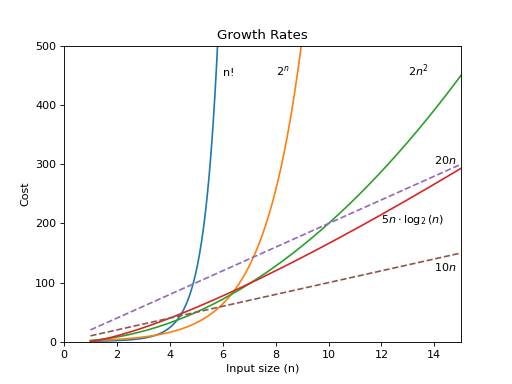
Two views of a graph illustrating the growth rates for six equations. The 'zoom' tab shows in detail the lower-left portion of this graph. The horizontal axis represents input size. The vertical axis can represent time, space, or any other measure of cost.
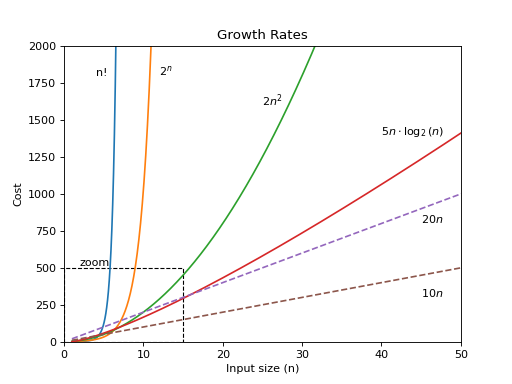
Zoom
The two equations labeled \(10n\) and \(20n\) are graphed by straight lines. A growth rate of \(cn\) (for \(c\) any positive constant) is often referred to as a linear growth rate or running time. This means that as the value of \(n\) grows, the running time of the algorithm grows in the same proportion. Doubling the value of \(n\) roughly doubles the running time. An algorithm whose running-time equation has a highest-order term containing a factor of \(n^2\) is said to have a quadratic growth rate. In the figure, the line labeled \(2n^2\) represents a quadratic growth rate. The line labeled \(2^n\) represents an exponential growth rate. This name comes from the fact that \(n\) appears in the exponent. The line labeled \(n!\) also grows exponentially.
As you can see from the figure, the difference between an algorithm whose running time has cost \(\mathbf{T}(n) = 10n\) and another with cost \(\mathbf{T}(n) = 2n^2\) becomes tremendous as \(n\) grows. For \(n > 5\), the algorithm with running time \(\mathbf{T}(n) = 2n^2\) is already much slower. This is despite the fact that \(10n\) has a greater constant factor than \(2n^2\). Comparing the two curves marked \(20n\) and \(2n^2\) shows that changing the constant factor for one of the equations only shifts the point at which the two curves cross. For \(n>10\), the algorithm with cost \(\mathbf{T}(n) = 2n^2\) is slower than the algorithm with cost \(\mathbf{T}(n) = 20n\). This graph also shows that the equation \(\mathbf{T}(n) = 5 n \log n\) grows somewhat more quickly than both \(\mathbf{T}(n) = 10 n\) and \(\mathbf{T}(n) = 20 n\), but not nearly so quickly as the equation \(\mathbf{T}(n) = 2n^2\). For constants \(a, b > 1, n^a\) grows faster than either \(\log^b n\) or \(\log n^b\). Finally, algorithms with cost \(\mathbf{T}(n) = 2^n\) or \(\mathbf{T}(n) = n!\) are prohibitively expensive for even modest values of \(n\). Note that for constants \(a, b \geq 1, a^n\) grows faster than \(n^b\).
We can get some further insight into relative growth rates for various algorithms from the following table. Most of the growth rates that appear in typical algorithms are shown, along with some representative input sizes. Once again, we see that the growth rate has a tremendous effect on the resources consumed by an algorithm.
Self Check
Q1
Given the following growth functions: \(n!, 2^n, 2n^2, 5n \log{2}n, 20n, \mbox{and} 10n\).
For the growth function \(n!\), type a value (a positive integer) for which this function is the most efficient of the six. If there is no value for which it is most efficent, type none.
Q2
Order the following functions so that finally the list will contain all the functions in ascending order of their growth rates.
-
5 * log(log(n) -
7 * sqrt(n) -
9 * n * log(n) -
pow(2, sqrt(n)) -
pow(2,pow(n,2)) -
pow(n, 4/3) -
pow(n,2) -
sqrt(n) * log(n)
Q3
Order the following functions so that finally the list will contain all the functions in ascending order of their growth rates.
-
2 * log(n) -
pow(2, sqrt(n)) -
pow(2,n) -
pow(n, 4/3) -
pow(n,4) -
sqrt(n) * log(n)
More to Explore
TBD