tb-graph
Use tb-graph to display a directed graph, tree, linked list, array, or ring.
Declare nodes with explicit keys and values, then connect them with arrows. The
same syntax supports all these structures without choosing a graph type.
Diagrams work without JavaScript and have readable descriptions.
Synopsis
The general format of the tb-graph directive is:
.. tb-graph:: [optional object key]
   :optional parameter: value

   + --- Graph data ---
   |
   | node declarations and directed relationships
   |
   + ------------------
The optional argument identifies this graph when highlight or qualified
overlay references target its nodes. It is separate from name, which
creates a Sphinx reference target.
An empty body displays an empty graph.
Options
- align
String. Optional. Horizontal alignment of the diagram:left,center, orright. Applies to HTML and PDF.- alt
String. Optional. Alternate text for the diagram. HTML uses it as the image’s alternate text; tagged PDF includes it with the image, and text output includes it before the graph description. If omitted, the alternate text useslabel, thencaption, thenGraph diagram. An explicitly empty value marks the image as decorative. Usedescriptionfor a longer explanation of the diagram.- caption
String. Optional. Plain-text caption displayed with the graph, only when provided.- class
String. Optional. Space-separated CSS class names. This is a Docutils common option. See Common options for details.- description
String. Optional. Plain-text explanation of the diagram. Use it to describe the instructional meaning, such as why a node is highlighted or what an insertion changes. It replaces the automatically generated text description in HTML, text, and PDF. Long descriptions can continue on indented option lines. Describe the relevant values and connections as well as their meaning.- highlight
String. Optional. Space-separated references to nodes in this graph, such astree.node[root] tree.node[child]. Requires an explicit object key, heretree. All references must resolve to declared nodes. Highlighted nodes have thicker borders. Highlighting an invisible node does not show it. For array content in tree/list nodes, select individual cells withtree.node[root].slot[0]; the containing array is not a highlight target.- indicators
String. Optional. None by default. Space-separatedlabel=positionpairs, such ashead=a current=b tail=c. Each pair adds a labelled arrow pointing to that node or array cell. Every style supports multiple indicators. Labels follow the same identifier rules as node keys and must be unique within the directive. Targets must be declared nodes in this graph; forward declarations and unused cells are allowed. Multiple indicators may point to the same target. Invisible targets keep their arrow position without exposing their value. A bare target key identifies a node, never the whole diagram. Local typed references are also accepted:current=.node[b]or, with the object keyvalues,current=values.node[b]. Array styles supportfirst=.begin,finish=.end, andcurrent=.slot[1]. Qualified forms such asfinish=values.endwork with an explicit object key.beginselects the first cell; in an empty array it coincides withend. The end boundary is a dotted empty box beyond a gap after the last real cell, which retains its rounded corners. The box is a position, not an extra cell or node. Usecurrent=nonewhen there is no target; the text description records this without drawing an arrow. These targets behave like tb-pointer. Tree/list nodes with array content usecurrent=.node[root].slot[0]orcurrent=tree.node[root].slot[0]. Select a concrete cell; a bare key or.node[root]cannot target the containing array. An object-key argument is not required for local references. Pairs may continue on indented option lines. Do not add spaces around=.- label
String. Optional. Plain-text object label. Displayed only when explicitly provided.- name
String. Optional. Sphinx reference target for this graph occurrence. It does not supply an object key. This is a Docutils common option. See Common options for details.- overlay
String. Optional. None by default. Draw outlines around groups of declared, visible node keys. Each line specifies one overlay, with one or more space-separated targets such asparent child. Bare local keys work without a graph object key. Qualified local references, such astree.node[parent], also work when the graph has that object key. Repeated targets count once within a group. Every graph style supports overlays, including array value cells. For array content in tree/list nodes, use.node[root].slot[0]ortree.node[root].slot[0]. Container keys cannot be overlay targets. Overlays do not change node placement and can encompass other objects between their targets. See Overlay groups for multiple overlays and individual settings.- overlay-layer
String. Optional. Defaults toforeground. Default layer for overlays: in front of the graph (foreground) or behind it (background). Requiresoverlay. Outlines are unfilled; graph objects cover portions of background outlines.- overlay-padding
Number. Optional. Defaults to8points. Default minimum space between target bounds and their enclosing outlines. Accepts finite numbers from0to1000. Requiresoverlay.- overlay-shape
String. Optional. Defaults toellipse. Default outline shape for overlays:ellipse,circle, orrectangle.boxis an alias forrectangle. Ellipses follow the orientation of the target group; circles have equal width and height; rectangles enclose an area parallel to the diagram edges. Requiresoverlay. This option does not change graph node shapes; use a named style for those.- show-indices
Flag. Optional. Disabled by default. Show zero-based indices alongside values in thearraystyle or a style based on it. Indices follow node declaration order, including invisible cells. In tree/list nodes with array content, each array has its own zero-based index row. Scalar nodes in other styles have no indices.- style
String. Optional. Defaults tograph. Choose a presentation preset:listuses horizontal light-blue boxes with arrowheads;treeuses vertical light-blue circles with straight connectors and no arrowheads.graphuses unfilled ellipses with directed arrows.arrayshows adjacent table cells horizontally, with only values visible by default.ringuses Graphviz’s circularcircolayout and unfilled ellipse nodes. Books can define additional style names intb_graph_styles. The graph data syntax and node identities are the same for every style.
Style configuration
tb_graph_styles in conf.py customizes built-in presets or adds named
styles. Settings describe presentation; authors do not write DOT attributes.
For example:
tb_graph_styles = {
    "list": {"fill": "#e0f2fe", "font-size": 14},
    "plain-list": {"base": "list", "fill": None},
    "vertical-array": {"base": "array", "orientation": "vertical"},
    "tree": {
        "fill": "#dcfce7", "highlight-fill": "#fde68a",
        "level-spacing": 0.4,
    },
}
Select the custom preset with :style: plain-list. Custom styles inherit
the configured built-in base. Unknown style names and settings are errors.
Setting |
Accepted values |
|---|---|
|
|
|
|
|
|
|
Color name or |
|
Color name or |
|
Color name or |
|
Font family name; defaults to |
|
Positive number in points; defaults to |
|
|
|
|
|
Boolean. Defaults to |
|
Positive minimum sibling spacing in inches; defaults to |
|
Positive minimum level spacing in inches; defaults to |
Array and ring presentation
array places cells in node declaration order, independently of edges or
forward references. It displays values without keys, indices, or connectors.
All cells in one array have the same width and height, sized to fit the longest
value. The first and last cells have rounded outer corners; interior joins
remain straight. An empty quoted value, such as spare[''], represents an
unused cell and receives a light-grey fill. Use unused-fill to change it.
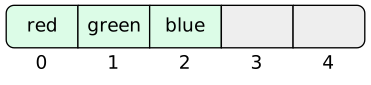
Use :show-indices: to add an index row below a horizontal array or an index
column to the left of a vertical array. Choose vertical orientation through a
named style in tb_graph_styles. Invisible nodes reserve undisplayed cells;
their values and indices remain hidden. Highlight borders and
highlight-fill apply to individual value cells.
Array styles preserve relationship data, but omit relationships from the diagram and its automatic description. Node shape, connector, arrow, and spacing settings do not affect the table. For sequence-specific features such as ranges and slot references, use tb-array.
ring selects Graphviz’s
circo layout for HTML and PDF.
Declare the closing edge explicitly to show a cycle; the style does not create
edges. Orientation and level spacing do not affect circular layout.
Indicators
Use :indicators: to point out positions such as the head, tail, or current
value. All styles support indicators. Indicator labels appear above horizontal
arrays and to the right of vertical arrays. Lists place labels below their
nodes; general graphs and rings place labels near their targets automatically.
Labels sharing a target are arranged together with separate arrows. Rings
reserve extra separation when indicators are present to keep labels readable.
Indicators annotate targets without adding semantic nodes or relationships.
Their targets follow node identity rather than the displayed value or index.
Tree styles, including book styles based on tree, support multiple
indicators and scene pointers. They may point to different nodes or share
a target, including the root or an internal node. Labels sharing a target
sit side by side, each with its own arrow. Each label group occupies a gap
between the target’s children, reusing the tree’s
invisible balancing space where available. A leaf’s label appears directly
below it. Arrows point back toward their targets without crossing other tree
nodes. Horizontal tree styles use the corresponding gap to the right.
The indicator arrow remains visible even when relationship arrowheads are
disabled by the style.
The automatic text description identifies each indicator’s target and value,
including cell indices for arrays. If you provide :description:, include
the indicator meanings and
positions in your explanation.
Tree spacing
The tree preset inserts invisible spacing nodes to center parents above
their children. Missing binary children reserve space on the appropriate
side: use -left-> and -right-> to specify that side. Other child edges
use source order; a lone unnamed child occupies the left position. Authors
do not need to declare these spacing nodes. They have no semantic identity
and do not appear in descriptions.
Presets change presentation without enforcing structural tree rules. Tree spacing applies to components that are trees; cyclic components and components with shared children retain ordinary automatic layout. Nodes grow to fit their values rather than clipping long labels.
Data syntax
Declare a node as key[value]. Values are numbers or single-quoted or
double-quoted strings. Numeric spelling is preserved. Strings support Unicode,
empty values, an escaped enclosing quote, and an escaped backslash. Other
escapes, including \n, are rejected. Keep each string on one physical line.
The data body contains literal values, not nested RST or Graphviz source.
Keys are case-sensitive identifiers beginning with a letter or underscore,
followed by letters, digits, underscores, or hyphens. The key null is
reserved. Node keys supply identity; values may repeat.
Use -> for a directed edge or -key-> for a named relationship:
a['10'] -> b['20'] -> c['30']

root['8'] -left-> child['3']
root -right-> other['12']
Spaces or tabs are required on both sides of each edge operator. Do not put
whitespace inside the operator or between a node key and its opening bracket.
Blank lines and # comments outside strings are ignored. Each nonempty
line is one complete declaration or edge chain. JSON objects may continue
across physical lines. Semicolons are unsupported.
Declare every node exactly once in the graph. Bare references can precede or follow that declaration. Repeating a value declaration is an error, even when its value agrees. An undeclared endpoint is an error.
Named relationships are unique per source node: one node cannot have two
-left-> edges. Different source nodes may reuse a relationship name.
Parallel edges between the same ordered pair require distinct names; do not
mix an unnamed edge with named parallel edges. Duplicate edges are errors.
Cycles, self-edges, disconnected nodes, and empty graphs are allowed.
Array content in tree and list nodes
Tree and list styles, including styles based on them, can display an array inside each node. Keep the graph flat: declare the content directly after its node key as a JSON object, without square brackets around the object:
root{"type": "array", "values": [54, 26, 93, 17]}
root -left-> left{"type": "array", "values": [54, 26]}
root -right-> right{"type": "array", "values": [93, 17]}
The object requires exactly type and values. The supported type is
"array". Values can be numbers, strings, or a mixture of both. Use strict
JSON: strings and field names use double quotes. JSON string escapes such as
\n and \\ are supported. Arrays of objects, nested arrays, booleans,
null values, non-finite numbers, and additional fields are errors.
An empty values array displays an empty array with no selectable cells.
JSON objects can span multiple lines. Scalar key[value] declarations
remain valid alongside array content.
Each array displays its cells in a row. All array cells within one graph have
uniform dimensions, measured to fit array values and scalar node labels.
Scalar nodes use the same minimum width and height; longer labels can grow.
First and last cells have rounded outer corners; interior joins remain
straight. A one-cell array has four rounded corners. Node keys identify arrays
in graph relationships; cells have zero-based positions within each array.
The tree/list style still controls relationships, spacing, fonts, and fills.
An array uses rectangular cells regardless of the scalar node shape.
:show-indices: adds a separate index row to each array.
Annotations select concrete cells with graph.node[root].slot[0].
Highlights require the graph key. Indicators and overlays also accept the
local form .node[root].slot[0]. A reference to the entire array node is
not an annotation target. Scene pointers use the same qualified cell
references. Scalars retain their existing graph.node[key] references.
Each graph has one diagram and one text description covering all its nodes.
Invisible components
Place {invisible} after a node declaration to hide the node. Place it
between an edge operator and its destination to hide that edge:
value['10'] -next-> unseen[''] {invisible}
value -spacing-> {invisible} spacer[''] {invisible}
Invisible components still participate in layout. Hiding a node does not hide
its incident edges. Edges always connect declared nodes; they cannot connect
to null. To draw an edge toward an undisplayed endpoint, declare an
invisible node and connect a visible edge to it.
Invisible edges and isolated invisible nodes are omitted from descriptions.
A visible edge reaching an invisible node is described as reaching an
undisplayed endpoint; that node’s hidden key and value are omitted.
Overlay groups
Each line of overlay defines a separate group. The directive’s
overlay-shape, overlay-layer, and overlay-padding options supply
defaults for all groups. Override any setting by adding
:overlay-shape: value, :overlay-layer: value, or
:overlay-padding: value after the target keys on that line:
:overlay: parent child
          other :overlay-shape: circle :overlay-layer: background :overlay-padding: 4
:overlay-shape: rectangle
:overlay-padding: 12
This draws a rectangle around parent and child with 12 points of
padding, and a circle behind other with 4 points of padding. Settings on
one line do not affect the next group. Write target keys before settings;
each setting can appear once per line. Continue each group on its own line
inside one overlay option; do not repeat the directive option.
Within each layer, later groups are drawn over earlier groups.
Build requirements
Install Graphviz on the computer that builds
HTML or LaTeX. The dot executable must be available on PATH; ring styles
also require circo on PATH. PDF asset
generation also requires Graphviz’s Cairo PDF renderer. Graphs with an
overlay require librsvg’s rsvg-convert on PATH for PDF export.
Install librsvg2-bin on Debian/Ubuntu or librsvg with Homebrew.
HTML annotations require only Graphviz. Readers need neither Graphviz,
librsvg, nor JavaScript.
Touchbook loads Sphinx’s Graphviz support automatically. If dot is installed
outside PATH, set graphviz_dot in conf.py:
graphviz_dot = "/path/to/dot"
Graphs use automatic layout. Select presentation with :style:. Raw DOT,
engine names, coordinates, and arbitrary Graphviz attributes are not accepted
in the directive.
Click questions
Use a graph as the source of tb-click to ask students to select nodes.
tb-hit and tb-miss select local visible node keys for every graph style.
Relationships and indicator labels remain ordinary diagram content.
See tb-click for a tree question example.
Accessibility behavior
HTML provides a diagram and a keyboard-accessible Text description
disclosure. The automatic description explains connections using displayed
values, identifies tree roots and leaves, and notes highlights and isolated
nodes. Duplicate values include node keys to distinguish their identities.
Use :description: to provide the explanation readers need for the lesson.
Object labels and captions appear only when explicitly provided.
Invisible components have no controls. Tree styles place named left and
right children on their corresponding sides. Relationship names remain
in descriptions even when a style omits them from the diagram.
Overlays are described by shape and target values and keys, including
when description supplies the main explanation. Outlines do not capture
clicks or keyboard focus.
Fallback behavior
HTML displays a static SVG without JavaScript. Text displays the graph
description. PDF includes a vector diagram and the same description, with
captions and labels outside the image. Empty graphs display Empty graph.
Array styles render the same adjacent cells and optional indices in HTML and
PDF; text describes their order and values.
Overlay outlines appear in HTML and PDF. Text describes the nodes they
surround. The diagram expands to keep the complete outline visible.
If Graphviz cannot render a diagram, the build warns and retains the readable
description. Builds with --fail-on-warning fail on that warning.
Examples
Example 1: An independent graph
Source
.. tb-graph::

   a['10'] -> b['20'] -> c['30']
Rendered
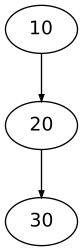
Text description
Directed graph with 3 visible nodes.
“10” points to “20”. “20” points to “30”.
Example 2: Named tree relationships
Source
.. tb-graph:: tree
   :style: tree
   :indicators: root=root current=inserted
   :caption: A tree with an inserted node
   :description: The root 8 has left child 3 and right child 12.
      Node 6, highlighted, is the right child of 3. Its position
      preserves the binary search tree ordering: 3 < 6 < 8.
      The root indicator points to node 8; current points to node 6.
   :highlight: tree.node[inserted]

   root['8'] -left-> child['3']
   root -right-> other['12']
   child -right-> inserted['6']
Rendered
A tree with an inserted node
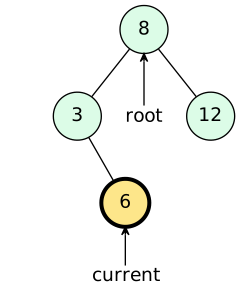
Text description
The root 8 has left child 3 and right child 12. Node 6, highlighted, is the right child of 3. Its position preserves the binary search tree ordering: 3 < 6 < 8. The root indicator points to node 8; current points to node 6.
Indicator “root” points to “8”.
Indicator “current” points to “6”.
Example 3: Forward references and cycles
Source
.. tb-graph::
   :label: A cycle and a disconnected node
   :indicators: start=a current=b

   a['first'] -> b -> c['third'] -> a
   b['second']
   separate['disconnected']
Rendered
A cycle and a disconnected node
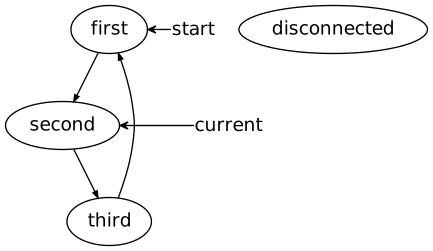
Text description
Directed graph with 4 visible nodes.
“first” points to “second”. “second” points to “third”. “third” points to “first”.
“disconnected” is isolated.
Indicator “start” points to “first”.
Indicator “current” points to “second”.
Example 4: An undisplayed endpoint
Source
.. tb-graph::
   :style: plain-list

   value['10'] -next-> unseen[''] {invisible}
Rendered
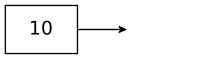
Text description
Linked list diagram with 1 visible node.
“10” points to an undisplayed endpoint through the “next” relationship.
Example 5: An empty graph and reference target
Source
.. tb-graph::
   :name: graph-reference-example
   :class: sample-graph
Rendered
Empty graph.
Refer to the last example with this graph.
Example 6: A horizontal doubly linked list
Source
.. tb-graph::
   :style: list
   :indicators: current=b

   head['head'] -> a[8] -> b[13] -> c[21] -> tail['tail']
   tail -> c -> b -> a -> head
Rendered

Text description
Linked list diagram with 5 visible nodes.
“head” points to “8”. “8” points to “13” and “head”. “13” points to “21” and “8”. “21” points to “tail” and “13”. “tail” points to “21”.
Indicator “current” points to “13”.
Example 7: Adjacent array values
Source
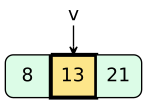
.. tb-graph:: values
   :style: array
   :highlight: values.node[b]
   :indicators: v=b

   a[8]
   b[13]
   c[21]
Rendered
Text description
Array with 3 cells. From left to right: “8”, “13”, and “21”.
“13” is highlighted.
Indicator “v” points to cell 1, value “13”.
Example 8: Array indices
Source
.. tb-graph::
   :style: array
   :show-indices:

   a['red']
   b['green']
   c['blue']
   spare1['']
   spare2['']
Rendered
Text description
Array with 5 cells. From left to right: index 0: “red”, index 1: “green”, index 2: “blue”, index 3: an unused cell, and index 4: an unused cell.
Example 9: A ring
Source
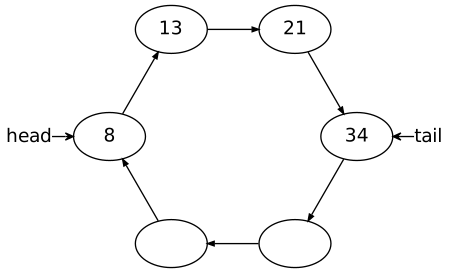
.. tb-graph::
   :style: ring
   :indicators: head=a tail=d

   a[8] -> b[13] -> c[21] -> d[34] -> e[''] -> f[''] -> a
Rendered
Text description
Circular graph diagram with 6 visible nodes.
“8” points to “13”. “13” points to “21”. “21” points to “34”. “34” points to an unlabeled node (node e). an unlabeled node (node e) points to an unlabeled node (node f). an unlabeled node (node f) points to “8”.
Indicator “head” points to “8”.
Indicator “tail” points to “34”.
Example 10: Outline a comparison
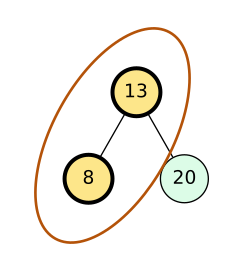
The default ellipse groups the parent and child being compared. Their thicker
borders identify both values. Use :overlay-layer: background to place the
outline behind the graph, or :overlay-padding: 12 to leave more space
around it.
See tb-stack Example 3 for outlines that follow swapped nodes.
Source
.. tb-graph:: heap
   :style: tree
   :highlight: heap.node[parent] heap.node[child]
   :overlay: parent child
   :description: Compare 13 with its left child 8 before swapping.

   parent[13] -left-> child[8]
   parent -right-> other[20]
Rendered
Text description
Compare 13 with its left child 8 before swapping.
An ellipse surrounds “13” (node parent) and “8” (node child).
Example 11: Multiple overlay shapes and layers
An ellipse groups the parent and its left child. A rectangle separately marks the right subtree behind the diagram. A circle marks its leaf in front. The smaller padding applies only to that circle.
Source
.. tb-graph::
   :style: tree
   :overlay: parent child
             other leaf :overlay-shape: rectangle :overlay-layer: background
             leaf :overlay-shape: circle :overlay-padding: 4

   parent[13] -left-> child[8]
   parent -right-> other[20]
   other -right-> leaf[24]
Rendered
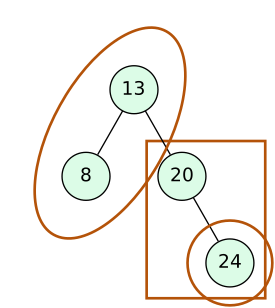
Text description
Tree diagram with 4 visible nodes.
The root is “13”.
“13” has left child “8” and right child “20”. “20” has right child “24”.
“8” and “24” are leaves.
An ellipse surrounds “13” (node parent) and “8” (node child).
A rectangle surrounds “20” (node other) and “24” (node leaf).
A circle surrounds “24” (node leaf).
Example 12: Alternate text and alignment
Center the diagram and give it a short alternate text. The detailed text description remains available separately.
Source
.. tb-graph::
   :alt: A three-node cycle
   :align: center

   a[8] -> b[13] -> c[21] -> a
Rendered
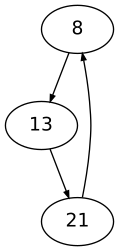
Text description
Directed graph with 3 visible nodes.
“8” points to “13”. “13” points to “21”. “21” points to “8”.
Example 13: Begin and end positions in an array
The end boundary appears separately from the three real cells. The unused
cell syntax c[''] still describes a real cell and has a different meaning.
Source
.. tb-graph::
   :style: array
   :indicators: first=.begin finish=.end

   a['a']
   b['b']
   c['c']
Rendered
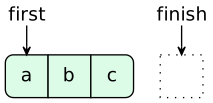
Text description
Array with 3 cells. From left to right: “a”, “b”, and “c”.
Indicator “first” points to cell 0, value “a”.
Indicator “finish” is at the end boundary, past the last element.
Example 14: Arrays in a merge tree
Source
.. tb-graph:: merge
   :style: tree
   :show-indices:
   :highlight: merge.node[left].slot[1]
   :indicators: current=.node[left].slot[1]
   :overlay: .node[left].slot[0] .node[left].slot[1]

   root{"type": "array", "values": [54, 26, 93, 17]}
   left{"type": "array", "values": [54, 26]}
   right{"type": "array", "values": [93, 17]}
   root -left-> left
   root -right-> right
Rendered
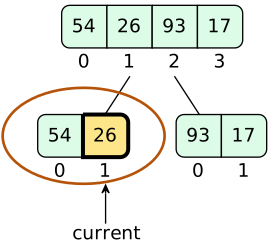
Text description
Tree diagram with 3 visible nodes.
The root is array node root with 4 cells [“54”, “26”, “93”, “17”].
array node root with 4 cells [“54”, “26”, “93”, “17”] has left child array node left with 2 cells [“54”, “26”] and right child array node right with 2 cells [“93”, “17”].
array node left with 2 cells [“54”, “26”] and array node right with 2 cells [“93”, “17”] are leaves.
“26” (node left, cell 1) is highlighted.
Indicator “current” points to “26” (node left, cell 1).
An ellipse surrounds “54” (node left, cell 0) and “26” (node left, cell 1).
Example 15: Arrays in a linked list
Source
.. tb-graph:: blocks
   :style: list
   :indicators: current=.node[first].slot[1]

   first{"type": "array", "values": ["a", 2]} -> second
   second{"type": "array", "values": ["b", 3]} -> tail[4]
Rendered
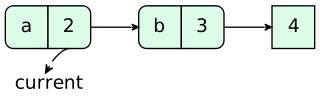
Text description
Linked list diagram with 3 visible nodes.
array node first with 2 cells [“a”, “2”] points to array node second with 2 cells [“b”, “3”]. array node second with 2 cells [“b”, “3”] points to “4”.
Indicator “current” points to “2” (node first, cell 1).